A price-time-priority limit order book and matching engine in C++20, built to the standard a trading firm would actually apply: no allocation on the hot path, a wait-free thread handoff, and every performance claim backed by a measurement you can reproduce.
Why it mattered
My entire programming life before Cisco was Python. Interning there on the Silicon One team, I built a C++17 single-pass index that reconstructed object lifecycles from SDK API traces — 284,671 events and 25,485 lifecycles out of a 54.8 MiB trace in 1.24 seconds median, at 76.95 MiB peak memory. Python would have gotten there eventually. In a networking context, where packets arrive on nanosecond timescales, “eventually” is the entire problem. Leka is what I built to stay in that world on purpose — and to find out whether I could hold that standard without a team around me.
The problem
A limit order book sits where two things I had never combined meet: systems engineering — allocation behaviour, cache lines, memory ordering — and market microstructure, which none of my coursework covered. It also inverted how I had worked with data before. I had cleaned large datasets, but always already knowing what was in them. Here the engine came first, and only afterwards did I have to go find data rigorous enough to trust as a benchmark, then be willing to write down, in public, when a distribution I had assumed turned out not to fit.
What I built
A tick-indexed price ladder instead of a sorted map: a price is an array index, not a search key, so best-of-book is a cached array read rather than a red-black-tree descent. Measured against std::map<Price, PriceLevel> across 2,000 price levels per side, 500,000 operations, min of 7 runs: 273.3 ns/op down to 131.3 ns/op — 2.1x.
Zero allocation on the hot path: intrusive FIFO order queues (O(1) cancel, stable addresses, no per-node allocation), a hand-rolled open-addressed order index with backward-shift deletion replacing std::unordered_map, and caller-owned execution buffers that remove one malloc per aggressive order. Together: 151.2 ns/op down to 115.5 ns/op, a 23.6% improvement, with the index alone accounting for 18.4%.
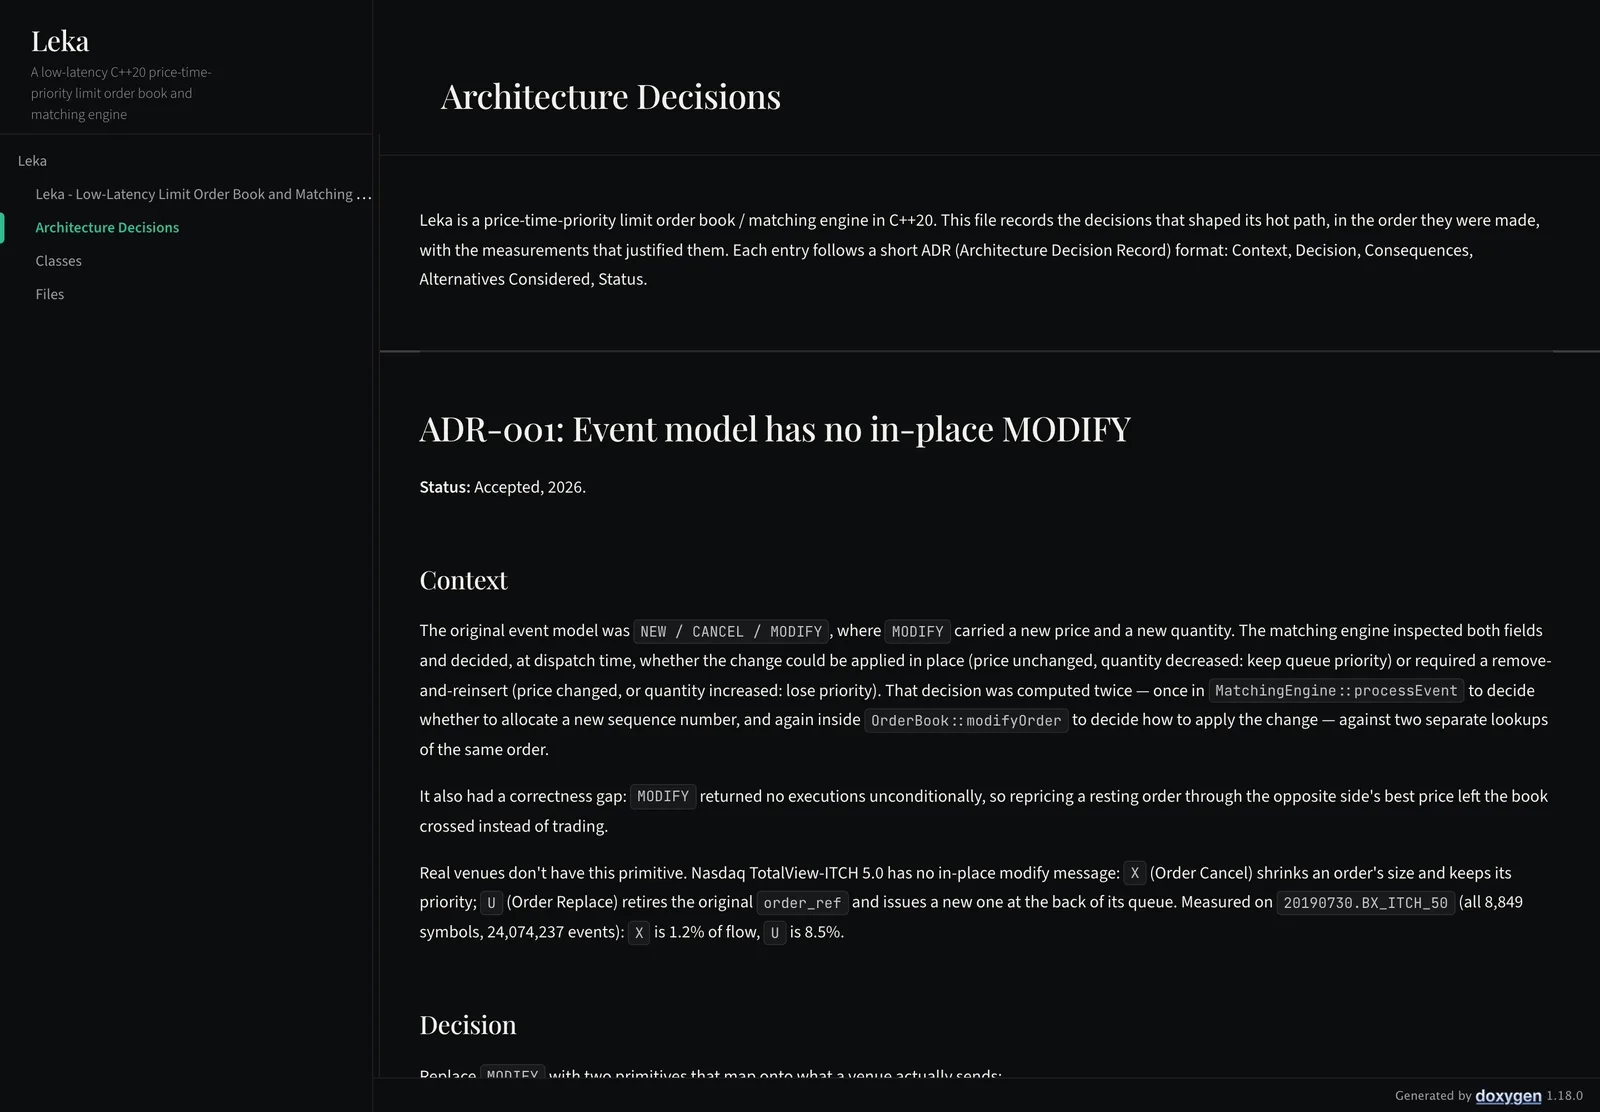
NEW / CANCEL / REDUCE, and deliberately no in-place MODIFY — because real venues do not have one. Nasdaq TotalView-ITCH shrinks an order in place (X) or retires it and reissues at the back of the queue (U), never both at once. Measured across the full 20190730.BX_ITCH_50 file — 8,849 symbols, 24,074,237 events — X is 1.2% of flow and U is 8.5%, so the event model maps onto what an exchange actually sends.
A wait-free single-producer/single-consumer ring buffer splitting a feed-handler thread from the matching thread: no compare-and-swap, acquire/release memory ordering, and cache-line-padded cursors so the two threads never share a line. Verified under ThreadSanitizer, which caught a real data race in my own benchmark harness before it ever caught one in the engine.
A real Nasdaq TotalView-ITCH 5.0 binary decoder, mmap'd and zero-copy, replaying an actual trading session end to end — including reconstructing the aggressor orders ITCH never publishes, by grouping executions that share a timestamp and resting side. Validated against 191,812 real rows: 2,154 of 2,154 executions grouped correctly, the book unwinding to exactly zero resting orders on both sides, zero desyncs.
Percentile latency instrumentation — p50/p90/p99/p99.9/max per event type, never a mean, because a mean hides exactly the tail a latency-sensitive system is judged on. On real data: NEW p50 83 ns / p99 209 ns across 95,015 samples, CANCEL p50 83 ns / p99 167 ns across 93,676, best-of-book query p50 41 ns / p99 42 ns.
Seven test binaries wired into CTest and CI, including a 20,000-operation randomized differential test of the order index against a std::unordered_map oracle — re-verifying the entire live set after every single operation — and a 2,000,000-event two-thread FIFO correctness test for the queue. Clean under AddressSanitizer, UndefinedBehaviorSanitizer and ThreadSanitizer.
Ten architecture decision records, each with context, the alternatives considered, and the measured before/after numbers — including the ones that lost, and the one where I was wrong.
Inside the app
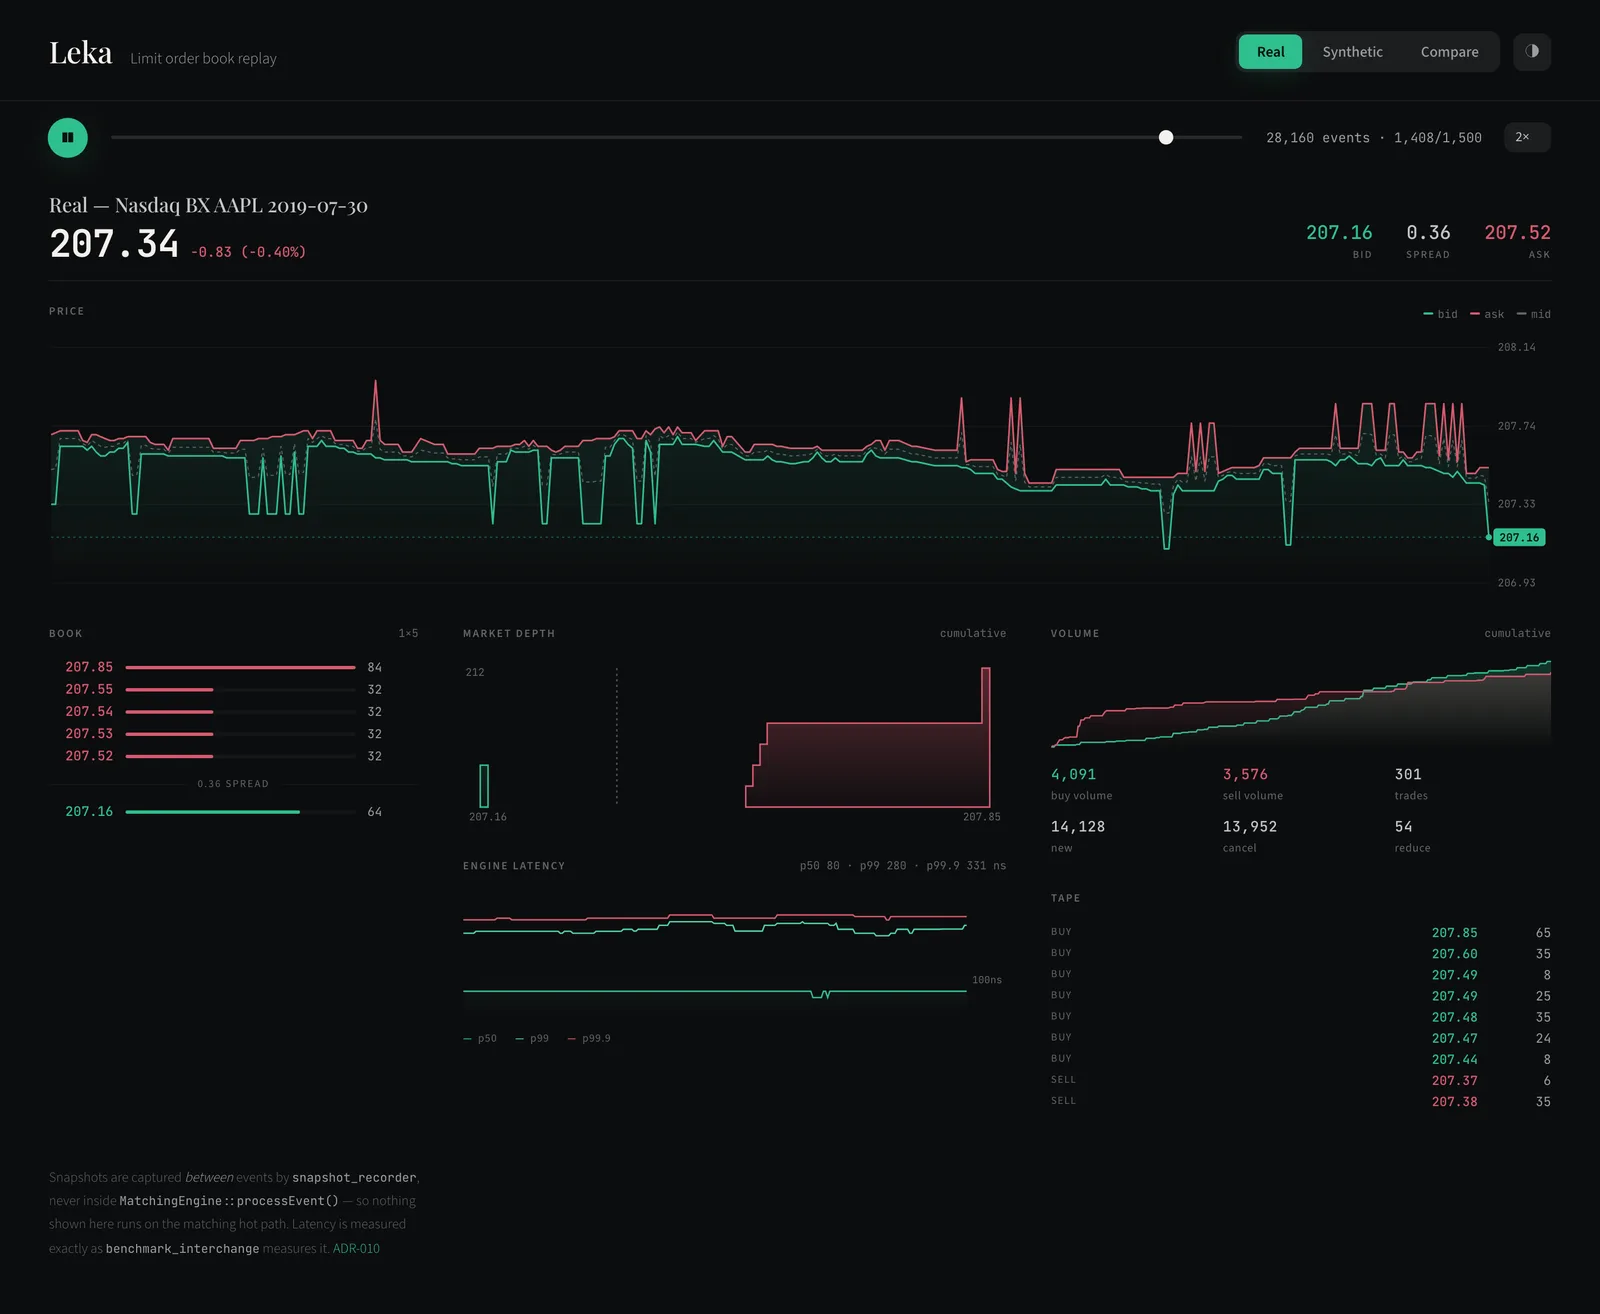
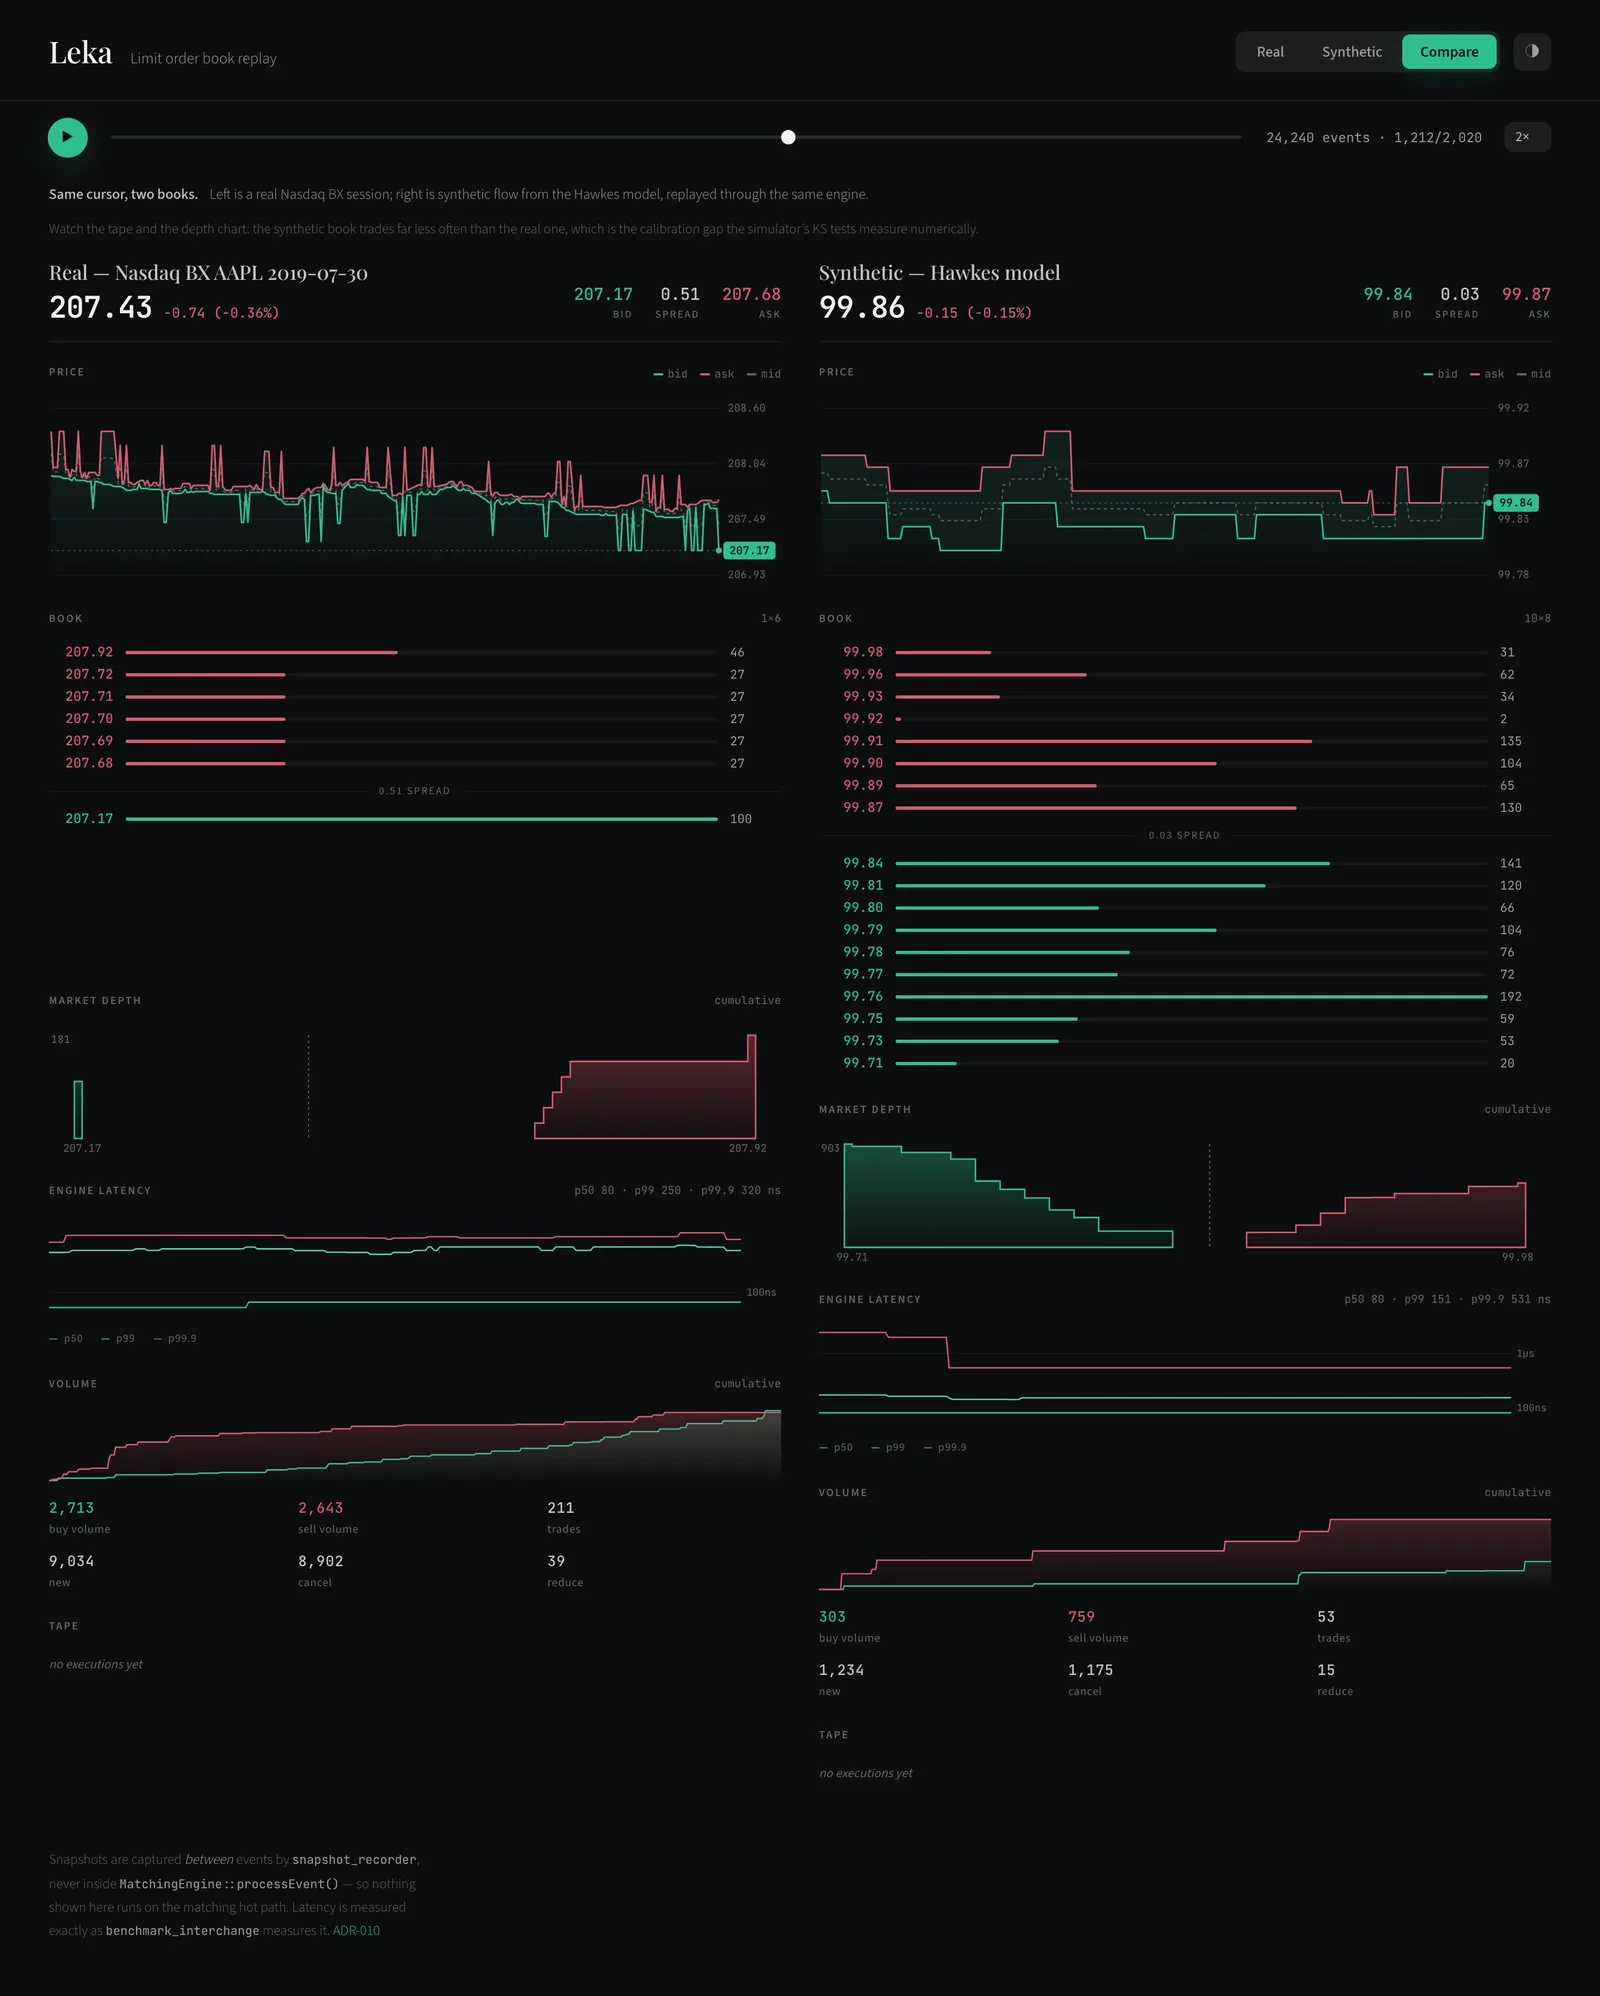

The engine actually running: a real Nasdaq BX session replayed end to end, the same cursor against synthetic Hawkes flow, and the decision record behind the hot path. Click any screen to enlarge
Real session replayA real Nasdaq BX session at 28,160 events — book, depth, tape, and p50/p99/p99.9 engine latency side by side.Real vs. synthetic flowOne cursor, two books: real Nasdaq flow against Hawkes-model synthetic flow — the calibration gap, shown rather than claimed.The engine runningSame session, playing. Snapshots are sampled between events, so nothing on screen runs on the matching hot path.The decision recordTen ADRs with context, alternatives and measured before/after numbers — including the hypothesis that turned out wrong.
Engineering notes
The hypothesis that measured wrong
A ~1 ms worst-case spike on resting orders looked like pool allocation, so I pre-allocated every page a run would need. It did improve p99.9 — and it did not touch the spike, which reproduced identically across five runs either way (969,875–1,258,375 ns before, 962,583–1,031,833 ns after: no separation at all). The real cause was the order index still growing by amortized doubling, a consequence I had already written down in an earlier ADR and left unaddressed. Reserving both structures took worst case to 59,125–79,750 ns — a 13–17x reduction, consistent across every run. The wrong hypothesis is in the record on purpose; it is the part of the process that actually generalises.
A mean would have hidden all of it
The first benchmark reported one mean over a book with a single price level — two mistakes at once. A single level cannot distinguish a tick ladder from an ordered map, and a mean cannot show a tail. Rebuilding it around 2,000 levels per side with a seeded, mixed workload and percentile reporting is what made both the 2.1x and the 1 ms outlier visible in the first place. Every number here is a ratio or a tail, because the absolute p50 sits at timer resolution on this machine and I would rather say so than quote it.
Letting the data size the book
A tick ladder needs a price range at construction, which is a real tradeoff, not a rounding error: guess generously and you waste memory while hiding whether the sizing logic even works; guess narrowly and a 20% intraday gap throws instead of degrading. The replay tool makes that choice from observed data — a first pass scans the session's actual traded range and adds configurable headroom — rather than from a constant I picked.
The viewer must not touch the hot path
The engine sustains roughly 5–7M events/sec; a display refreshes at 60fps. That is about 100,000 events per frame, so a viewer cannot consume the event stream — it has to consume periodic sampled state. Snapshots are captured between events, never inside MatchingEngine::processEvent(), because a reader that shared a cache line with the writer would invalidate the entire measurement history in one commit.
Where the model stops matching reality
A companion project fits an empirical order-flow model against the same ITCH sessions: a Cont–Stoikov–Talreja Poisson baseline against a Hawkes self-exciting alternative, branching ratio fit by maximum likelihood rather than assumed, validated against real stylized facts — spread distribution, volatility clustering, fill probability by queue position. The compare view in the viewer shows the gap honestly: the synthetic book trades far less often than the real one, which is exactly what the KS tests measure numerically.
Curious about any of this?
I am glad to go deeper on the architecture, the tradeoffs, or the parts that did not work
the first time. That conversation is usually more useful than the README.